Application Performance Monitoring
Content Table
What is Elastic APM
Elastic APM is an application performance monitoring system created within the Elastic Stack. It allows real-time monitoring of services and software applications by collecting information about execution traces and response times for incoming requests, database queries, external HTTP requests, and more. This makes it easier to quickly identify and solve performance issues.
It provides monitoring systems with information about what happened before an error appeared in the logs, or which processes are being executed and how they are running when CPU usage spikes.
In addition, Elastic APM automatically collects unhandled errors and exceptions. Errors are grouped according to stack traces, making it possible to identify new errors as they appear and track how often specific errors occur.
In the case of OpenESB monitoring, this is especially useful for analyzing BPEL executions that end with unhandled errors.
Elastic APM Components
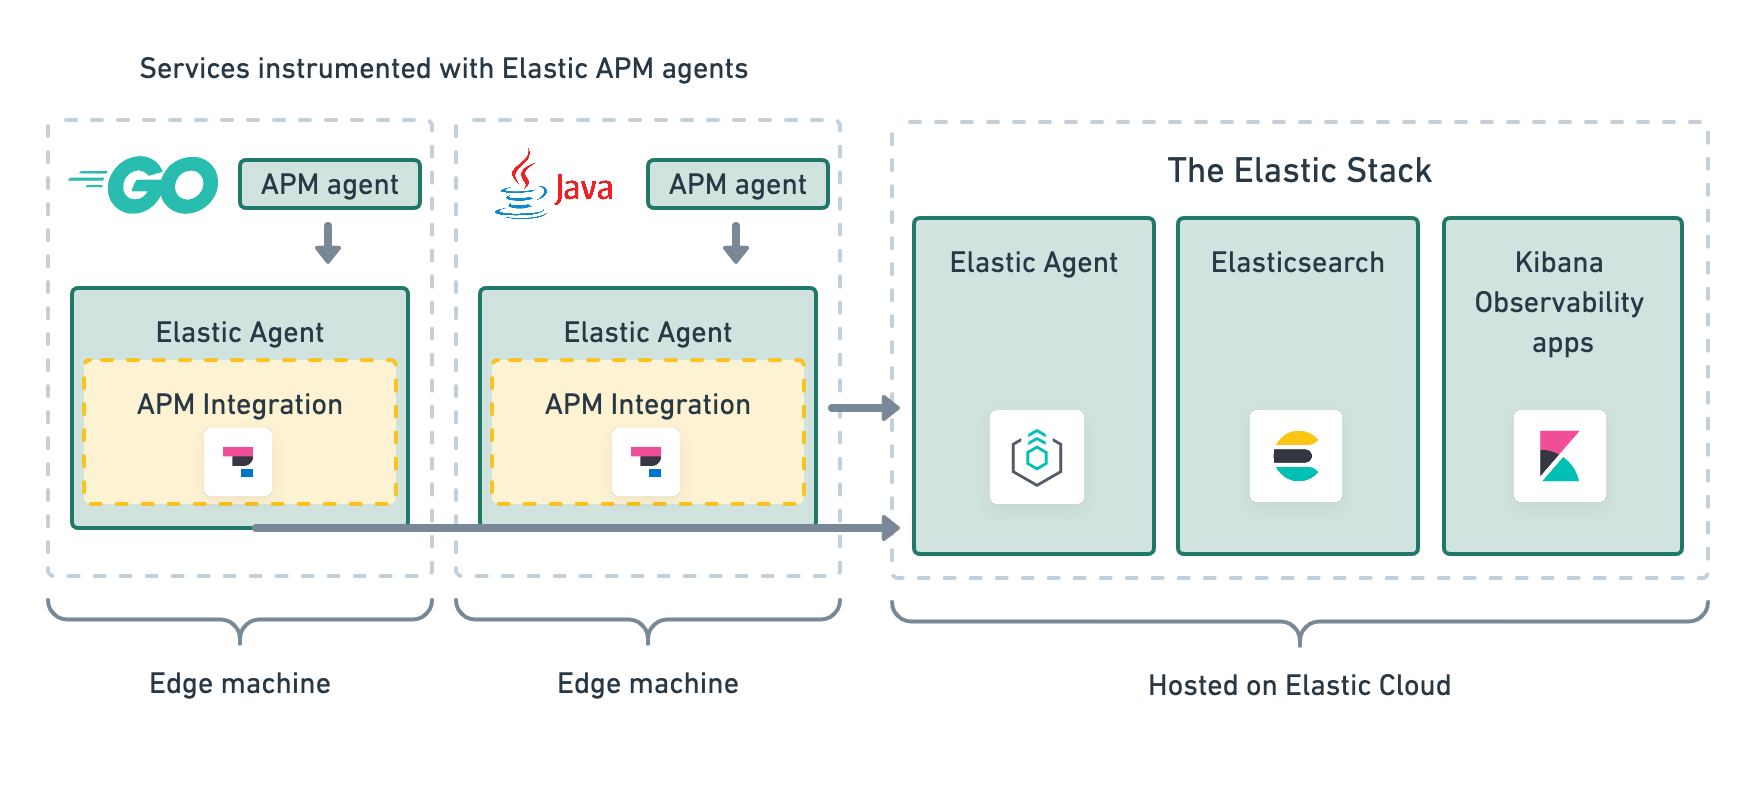
Elastic APM consists of four components: APM agents, Elastic integration (APM Server), Elasticsearch, and Kibana.
In general, these four components can work in two different ways:
-
Deploying the APM Server on the same machine where the monitored process is running.
-
Deploying the APM Server directly on the Elastic server itself.
In the case of the VICO OpenESB distribution, the APM Server is deployed on the same machine where OpenESB is running, as shown in the following diagram.
De estos cuatro componentes los propios de APM son:
-
APM agents: bibliotecas de código abierto escritas en el mismo lenguaje de programación que el servicio a monitorizar. Se instalan como instalaría cualquier otra biblioteca. Instrumentan el código y recopilan datos de rendimiento y errores en tiempo de ejecución. Estos datos se almacenan en el búfer durante un breve período y se envían al APM Server. En el caso de la monitorización de OE Vico se utiliza el Agente Java que se describe más abajo (ver #Elastic-APM-Java-Agent)
-
APM Server: recibe datos de rendimiento de sus agentes de APM, los valida y los procesa, y luego transforma los datos en documentos que envia a Elasticsearch. Quitar esta lógica de los agentes de APM ayuda a mantenerlos livianos, previene ciertos riesgos de seguridad y mejora la compatibilidad en el Elastic Stack.
The APM-specific components among these four are:
APM Agents
Open-source libraries written in the same programming language as the service being monitored. They are installed just like any other library. They instrument the code and collect runtime performance and error data. This data is buffered for a short period of time and then sent to the APM Server.
In the case of VICO OpenESB monitoring, the Java Agent described below is used (see #Elastic-APM-Java-Agent).
APM Server
Receives performance data from APM agents, validates and processes it, and then transforms the data into documents that are sent to Elasticsearch.
Removing this logic from the APM agents helps keep them lightweight, prevents certain security risks, and improves compatibility within the Elastic Stack.
Elastic APM Data Model
Before describing in detail the Java Agent used to monitor VICO OpenESB, it is necessary to provide a high-level overview of the Elastic APM data model, that is, the entities defined within its domain model and the information they represent, especially two of them: Transactions and Spans.
Transactions
Transactions are a special type of Span that includes additional associated attributes.
They describe an event captured by an Elastic APM agent instrumenting a service. Transactions can be considered the highest-level operation being measured within a service.
Examples of transactions include:
-
A request to a server
-
A batch process
-
A background execution
-
A custom transaction
A transaction may contain [0..N] spans and can also be the parent of other transactions.
A transaction contains the following attributes:
-
The event timestamp
-
A unique identifier (
unique id), a type (type), and a name (name) -
Information about the environment where the event occurs
-
Environment-related data such as:
-
Service — environment, framework, language, etc.
-
Host — architecture, hostname, IP address, etc.
-
Process — args, PID, PPID, etc.
-
URL — full URL, domain, port, query parameters, etc.
-
User — (if supplied) email, ID, username, etc.
-
-
Other relevant information depending on the agent
In addition, agents allow capturing custom metadata. Metadata can be indexed (labels) or non-indexed (custom fields). Later we will see which metadata is added in the case of VICO OpenESB.
Spans
Spans contain information about the execution of a specific code path. They measure the execution of an activity from start to finish and can have parent/child relationships with other spans.
Agents automatically instrument a variety of libraries to capture spans from the application, but the agent API can also be used for custom instrumentation of specific code paths, as is the case with VICO OpenESB to monitor the execution of all activities within a BPEL process.
A Span may contain:
-
A
transaction.idattribute that references its main transaction -
A
parent.idattribute that references its parent Span or Transaction -
Start time and duration
-
A
name,type,subtype, andaction -
An optional stack trace, including attributes such as:
-
Function name
-
File name and path
-
Line number
-
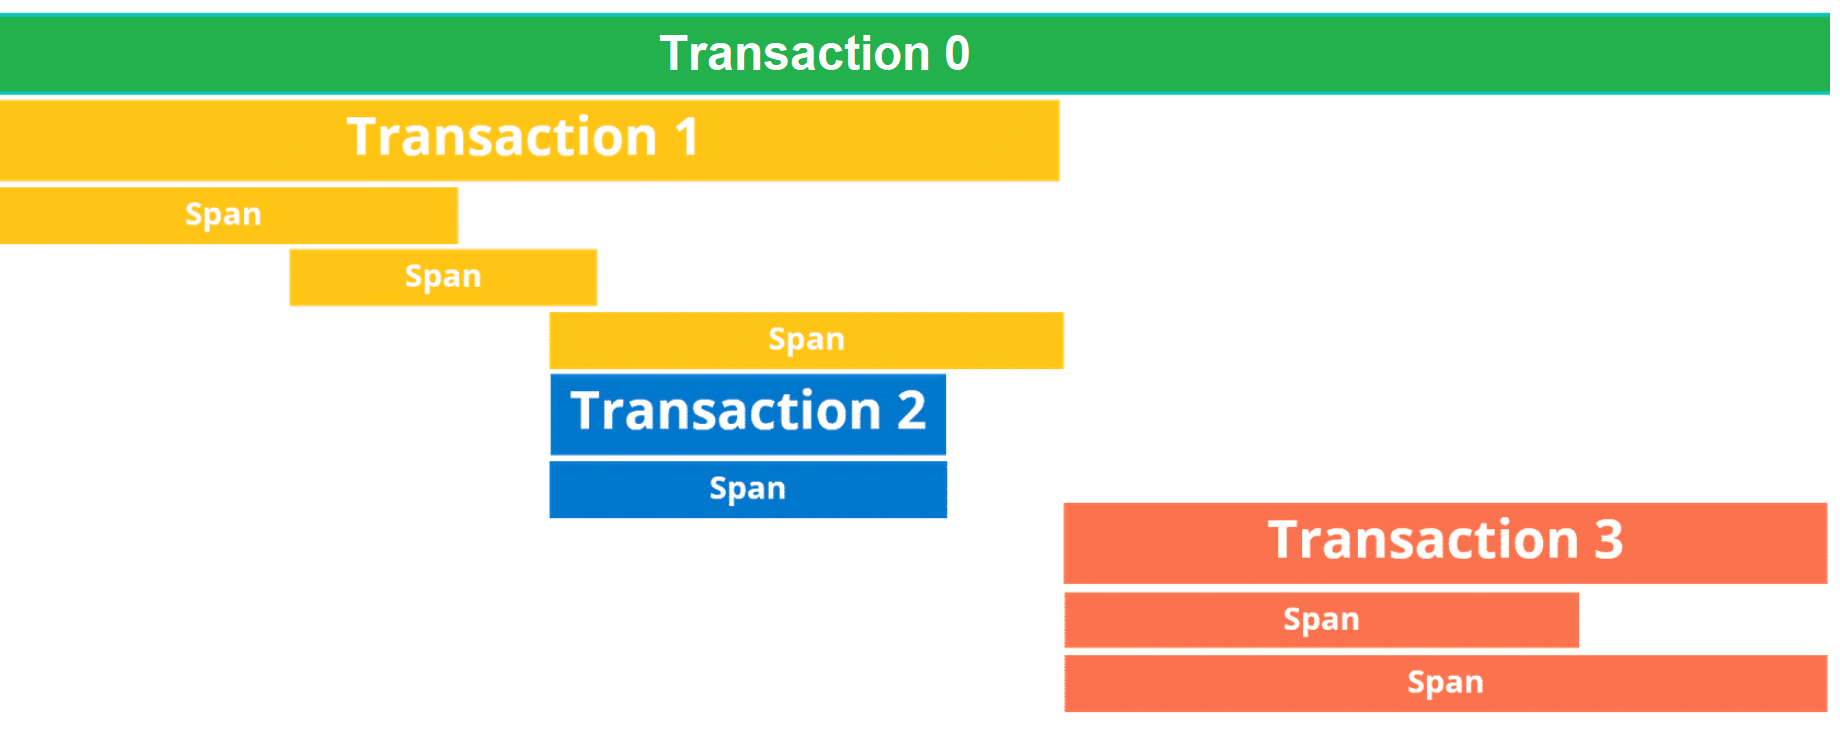
The following image shows an example of process monitoring. It displays a parent transaction (0) with several child transactions, and each transaction contains its associated spans.
Elastic APM Java Agent
The Elastic APM Java Agent automatically measures application performance and tracks errors. It provides built-in support for popular frameworks and technologies, as well as a simple API that allows instrumentation of any application.
The agent automatically instruments supported technologies and records interesting events, such as spans for database queries and transactions for incoming HTTP requests. To achieve this, it leverages the JVM's capability to instrument class bytecode. This means that for supported technologies, no code changes are required.
Spans are grouped into transactions by default, typically one transaction per incoming HTTP request. However, it is also possible to create custom transactions that are not associated with an HTTP request.
Transactions and spans are sent to the APM Server, where they are converted into a format suitable for Elasticsearch. You can then use the APM application in Kibana to gain insight into latency issues and identify the root causes of errors within your application.
More detailed information about how the Agent works can be found in this FAQ.
In addition to auto-instrumentation, the agent also provides an API that allows developers to add annotations or ad-hoc code into the source code in order to obtain customized monitoring (see Public API). This functionality is leveraged by the VICO OpenESB distribution to implement monitoring capabilities.
OpenESB Instrumentation Implemented by the VICO Distribution
The OpenESB instrumentation implemented by the VICO distribution varies depending on the component:
sun-http-binding
Although it might appear that HTTP requests are automatically instrumented, this is not the case because this binding listens for requests at the HTTP level but does not expose Servlets, while the Java Agent auto-instrumentation works at the Servlet level.
For this reason, a custom transaction is created for each incoming HTTP request.
sun-bpel-engine
All instrumentation for this component is based on the use of the custom API, creating:
-
One transaction for each BPEL execution
-
Spans indicating the start and end of each activity execution within the BPEL process
sun-jms-binding
This component is automatically instrumented, registering one transaction for each received request.
Transactions and Relationships Between Transactions
Based on the Elastic APM data model and the instrumentation implemented by VICO OpenESB, the following transactions are created:
-
One transaction for each call to
sun-http-binding(HTTP request) -
One transaction for each call to
sun-jms-binding(queue read) -
One transaction for each BPEL execution
The transaction created in sun-http-binding has as its child transaction the first executed BPEL.
At the moment, the transaction created in sun-jms-binding does NOT have child transactions; the BPEL execution is treated as an independent transaction.
If BPEL 1 invokes BPEL 2, then the transaction of BPEL 2 becomes a child transaction of BPEL 1, recursively.
Spans
The asynchronous activity execution model of the OpenESB BPEL engine does not allow activities to be monitored as a single Span. The engine receives activity start and end events, but execution of an individual activity is not blocked.
This characteristic, which is useful for parallel activity execution, prevents monitoring each activity with a single Span.
Therefore, in the VICO OpenESB instrumentation, the created spans are:
-
One Span indicating the start of an activity
-
One Span indicating the completion of an activity, whether normal completion or fault
Transaction Names
Transaction names vary depending on the OpenESB component, since in some components transactions are started automatically through auto-instrumentation, while in others they are created by adding ad-hoc instrumentation code.
The following table shows the transaction naming convention depending on the OpenESB component.
| Component | Transaction Name | Description |
|---|---|---|
sun-http-binding | SOAP service address | The value corresponds to the XML element soap:address/@location of the service being executed. For example, for the following service definition: xml<br><service name="TestAPMCA1Service1"><br> <port name="casaPort1" binding="tns:casaBinding1"><br> <soap:address location="http://localhost:\${HttpDefaultPort}/TestAPMCA1Service1/casaPort1"/><br> </port><br></service><br>the resulting transaction name is:text<br>/TestAPMCA1Service1/casaPort1<br> |
sun-bpel-engine | WSDL operation that starts the BPEL | The value corresponds to the targetNamespace of the WSDL that starts the BPEL plus the name of the executed operation. For example, if the WSDL that starts the BPEL is:xml<br><?xml version="1.0" encoding="UTF-8"?><br><wsdl:definitions targetNamespace="http://emprego.xunta.es/Sample/SampleService"><br> ...<br> <wsdl:portType name="SamplePortType"><br> <wsdl:operation name="SampleOperation"><br>the resulting transaction name is:text<br>{http://emprego.xunta.es/Sample/SampleService}SampleOperation<br> |
sun-jms-binding | Pending | Pending definition. |
Custom Labels
Custom labels are divided into two categories:
-
Labels common to all transactions, regardless of the component where the transaction is initiated.
-
Component-specific labels.
At the moment, these labels are not added to auto-instrumented transactions (sun-jms-binding component), although this improvement is planned for a future version of the component.
The following table shows the common custom labels added to transactions created in the sun-http-binding and sun-bpel-engine components.
The following table shows the labels specific to the sun-http-binding component.
| Label Name | Value | Description |
|---|---|---|
OE-Component | sun-http-binding | Indicates the component where the transaction was initiated. |
HostName | Server Name | Name of the server where the process creating the transaction is executed. |
EmpregoIdOperacion | SPEG Operation ID | If the received request contains the XML element "http://emprego.xunta.es/xpta/xpta/core.xsd":"idOperacion" or "http://emprego.xunta.es/xpta/xpta/service":"operationId", its value is recorded. |
EmpregoIdFunction | SPEG Functionality ID | If the received request contains the XML element "http://emprego.xunta.es/xpta/xpta/service":"functionId", its value is recorded. |
EmpregoToken | OpenAM Token | If the received request contains the XML element "http://emprego.xunta.es/xpta/xpta/core.xsd":"tokenID" or "http://emprego.xunta.es/xpta/xpta/service":"token", its value is recorded. |
EmpregoPersonaFisicaPerCod | SPEG Physical Person Code | If the received request contains the XML element "http://emprego.xunta.es/xpta/xpta/service":"perCod", its value is recorded. |
EmpregoPersonaFisica | SPEG Physical Person Identifier (NIF) | If the received request contains the XML element "http://emprego.xunta.es/xpta/xpta/service":"personaFisica", the value of "type" + "number" + "letter" belonging to the same namespace is recorded (first occurrence). |
The next table show the tags of the component sun-bpel-engine
| Nombre Etiqueta | Valor | Descripción |
|---|---|---|
| OE-Component | sun-bpel-engine | Indica en que componente se ha iniciado la transacción |
| HostName | Nombre de Servidor | Nombre del servidor donde se ejecuta el proceso que crea la transacción |
| Label Name | Value | Description |
BpelEndpointServiceName | Invoked Partner Link | Full name (namespace + PartnerLink) of the executed PartnerLink. For example, if the following PartnerLink is invoked:xml<br><?xml version="1.0" encoding="UTF-8" ?><br><process name="testAPMBpel1"<br> targetNamespace="http://enterprise.netbeans.org/bpel/TestAPMBpel1/testAPMBpel1"<br> ...<br> <partnerLinks><br> <partnerLink name="PLRetrievePrivileges"<br> xmlns:ws="http://emprego.xunta.es/diplos/RetrieveLoginPrivilegesService"<br> partnerLinkType="ws:RetrieveLoginPrivilegesPL"<br> myRole="RetrieveLoginPrivilegesPortTypeRole"/><br> </partnerLinks><br>the resulting value is:text<br>{http://enterprise.netbeans.org/bpel/TestAPMBpel1/testAPMBpel1}PLRetrievePrivileges<br> |
BpelMessageExchangeId | JBI Message Exchange | Message exchange identifier within the JBI platform, useful for tracing execution in OpenESB log messages. |
BpelEngineId | BPEL Engine ID | Identifier of the BPEL Engine where the BPEL process is executed. |
BPELName | BPEL Name | Stores the name of the executed BPEL process at the BPEL transaction level. |
BPELEvent | Event Type | Type of event associated with the BPEL process: [Start|Complete|Terminate|Faulted]. |
ServiceAssemblyName | Composite Application Name | Stores the name of the Composite Application (CA) at the BPEL transaction level. |
RequestMessage | Request XML | If ELK Monitoring Request/Response Enabled is active at the sun-bpel-engine component level, the first 1 KB of the XML request received by the BPEL process is stored. |
RequestMessageExtended | Request XML | If ELK Monitoring Request/Response Enabled is active at the sun-bpel-engine component level, the first 10 KB of the XML request received by the BPEL process is stored in a non-indexed field (transaction.custom.RequestMessageExtended). |
ResponseFaultMessage | Fault Message XML | If ELK Monitoring Request/Response Enabled is active at the sun-bpel-engine component level and the service response is a fault message, the first 1 KB of the response is stored. For example, in the following WSDL:xml<br><wsdl:portType name="RetrieveLoginPrivilegesPortType"><br> <wsdl:operation name="RetrieveLoginPrivilegesOperation"><br> <wsdl:documentation><br> Returns the privileges associated with a login<br> </wsdl:documentation><br> <wsdl:input name="InputRtrLP" message="ws:RetrieveLoginPrivilegesInput"/><br> <wsdl:output name="OutputRtrLP" message="ws:RetrieveLoginPrivilegesOutput"/><br> <wsdl:fault name="FaultRtrLP" message="ws:RetrieveLoginPrivilegesFault"/><br> </wsdl:operation><br>the label will only exist if the response message is of type:xml<br><wsdl:fault name="FaultRtrLP" message="ws:RetrieveLoginPrivilegesFault"/><br> |
ResponseFaultMessageExtended | Fault Message XML | If ELK Monitoring Request/Response Enabled is active at the sun-bpel-engine component level and the service response is a fault message, the first 10 KB of the response is stored in a non-indexed field (transaction.custom.ResponseFaultMessageExtended). |
EmpregoIdOperacion | SPEG Operation ID | If the received request contains the XML element "http://emprego.xunta.es/xpta/xpta/core.xsd":"idOperacion" or "http://emprego.xunta.es/xpta/xpta/service":"operationId", its value is recorded. |
EmpregoIdFunction | SPEG Functionality ID | If the received request contains the XML element "http://emprego.xunta.es/xpta/xpta/service":"functionId", its value is recorded. |
EmpregoToken | OpenAM Token | If the received request contains the XML element "http://emprego.xunta.es/xpta/xpta/core.xsd":"tokenID" or "http://emprego.xunta.es/xpta/xpta/service":"token", its value is recorded. |
EmpregoPersonaFisicaPerCod | SPEG Physical Person Code | If the received request contains the XML element "http://emprego.xunta.es/xpta/xpta/service":"perCod", its value is recorded. |
EmpregoPersonaFisica | SPEG Physical Person Identifier (NIF) | If the received request contains the XML element "http://emprego.xunta.es/xpta/xpta/service":"personaFisica", the value of "type" + "number" + "letter" belonging to the same namespace is recorded (first occurrence). |
EmpregoIdOperacionResponse | SPEG Operation ID | If the response contains the XML element "http://emprego.xunta.es/xpta/sso/authenticate":"operationId" (SPEG horizontal authentication service) or "http://emprego.xunta.es/xpta/xpta/service":"token", its value is recorded. |
EmpregoTokenResponse | OpenAM Token | If the response contains the XML element "http://emprego.xunta.es/xpta/sso/authenticate":"token" (SPEG horizontal authentication service), "http://xml.netbeans.org/schema/autenticarXmlSchema":"tokenID" (legacy service version), or "http://emprego.xunta.es/xpta/xpta/service":"token", its value is recorded. |
Span
Span Names
The name of the spans representing an event associated with a BPEL activity follows this format:
notee9d680486ea1
Activity Name + "::" + Activity Type + "::" + "[Start|Complete|Terminate|Faulted]"
Activity Name + "::" + Activity Type + "::" + "[Start|Complete|Terminate|Faulted]"
Custom Labels
The following table describes the span-level labels representing an event associated with a BPEL activity.
| Nombre Etiqueta | Valor | Descripción |
|---|---|---|
| ServiceAssemblyName | Nombre de la CA | Nombre de la CA en el que está desplegado el BPEL |
| Label Name | Value | Description |
BPELName | BPEL Name | Name of the BPEL process to which the activity belongs. For example, for the following BPEL:xml<br><?xml version="1.0" encoding="UTF-8" ?><br><process name="testAPMBpel1"<br> targetNamespace="http://enterprise.netbeans.org/bpel/TestAPMBpel1/testAPMBpel1"<br> ...<br>the recorded value is:text<br>testAPMBpel1<br> |
ActivityName | Activity Name | The name assigned by the developer to the activity. |
ActivityType | Activity Type | Type of BPEL activity (if, invoke, receive, etc.). |
ActivityEvent | Event Type | Type of event associated with the activity: [Start|Complete|Terminate|Faulted]. |
TargetPortType | Invoked BPEL | Only for activities of type invoke. The invoked BPEL process is recorded, making it possible to trace calls between BPEL processes. |
Handled Errors and Unhandled Errors
When monitoring an OpenESB instance, it is important to distinguish between transactions that end with handled errors and those that end with unhandled errors.
Transactions that end with handled errors are considered successful at the APM level, meaning their event.outcome = success. However, if they are transactions from the sun-bpel-engine component, they include the ResponseFaultMessage label, which allows identification of Fault responses.
On the other hand, transactions that end with unhandled errors are considered actual errors at the APM level, meaning the parent transaction has event.outcome = failure.
Additionally, in the ELK APM dashboard, transactions with errors are marked accordingly, and the errors can be reviewed in the Errors tab.
Transaction with Error Label
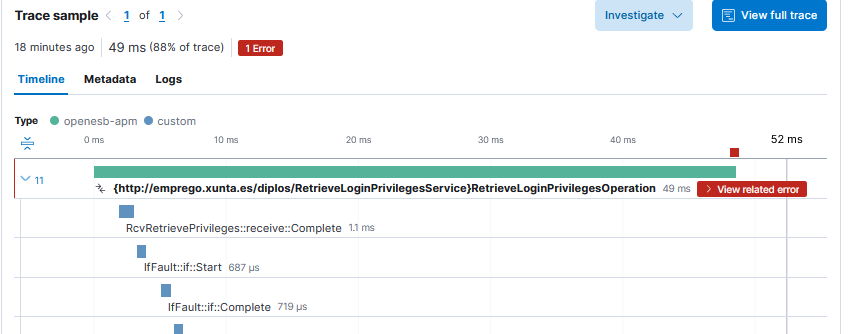
Tab for Reviewing All Errors
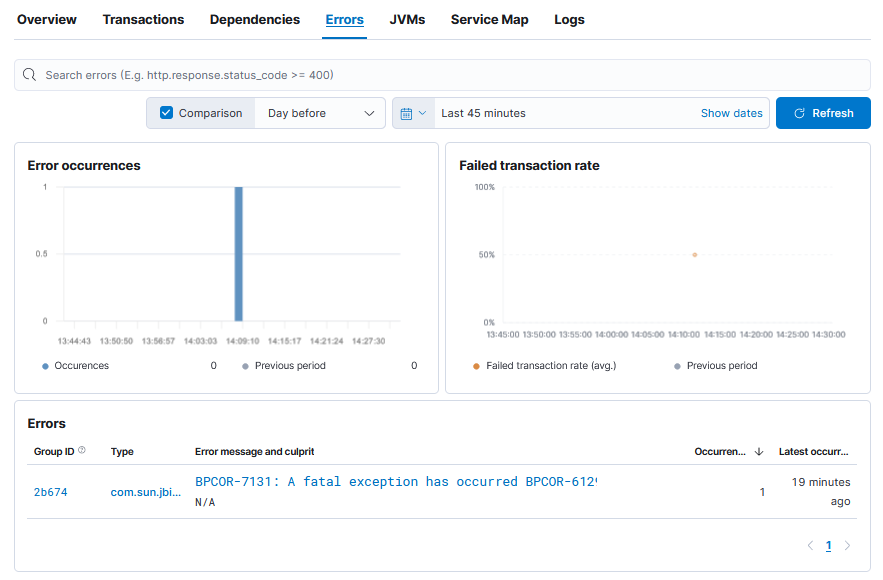
OpenESB APM within Elastic
OpenESB APM Tab
Manual Index Queries
All information visible in APM is obtained from the corresponding Elasticsearch indices. Therefore, these indices can also be used to build custom queries.
The following queries have been created as examples in Kibana (apm-oe-*):
Notes
-
All queries include a time filter.
-
Some filters have been created directly in the query bar, since partial searches are not defined in the same way when created through the interface.
-
Screenshots may not match the latest version of the query. Please refer to Kibana for the most up-to-date version.
apm-oe-duracion-actividades
Shows the execution times of invoke activities and allows filtering by a minimum duration in order to detect anomalies.
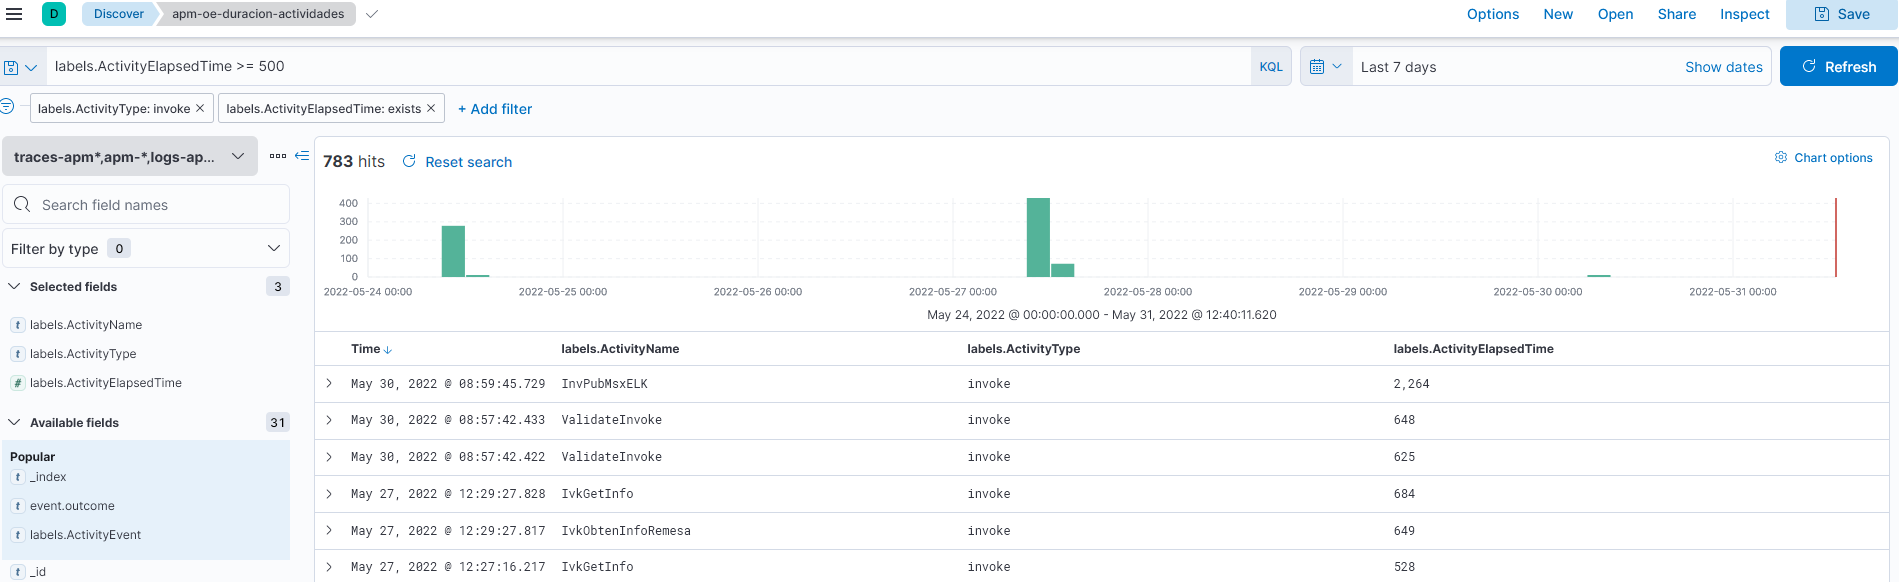
- apm-oe-llamadas-http
Show calls of HTTP
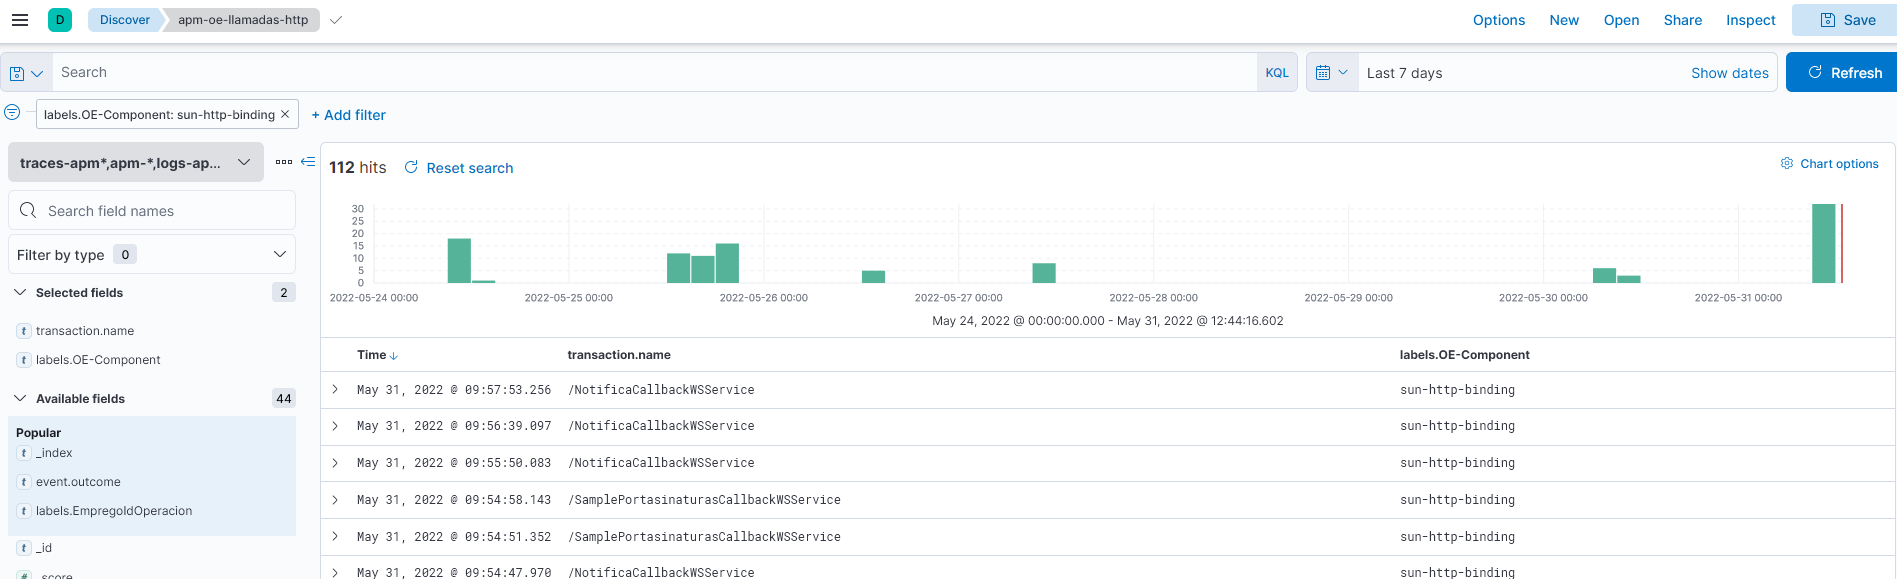
- apm-oe-receives-jms-cola
Shows queue reads, including the XML message that was read.
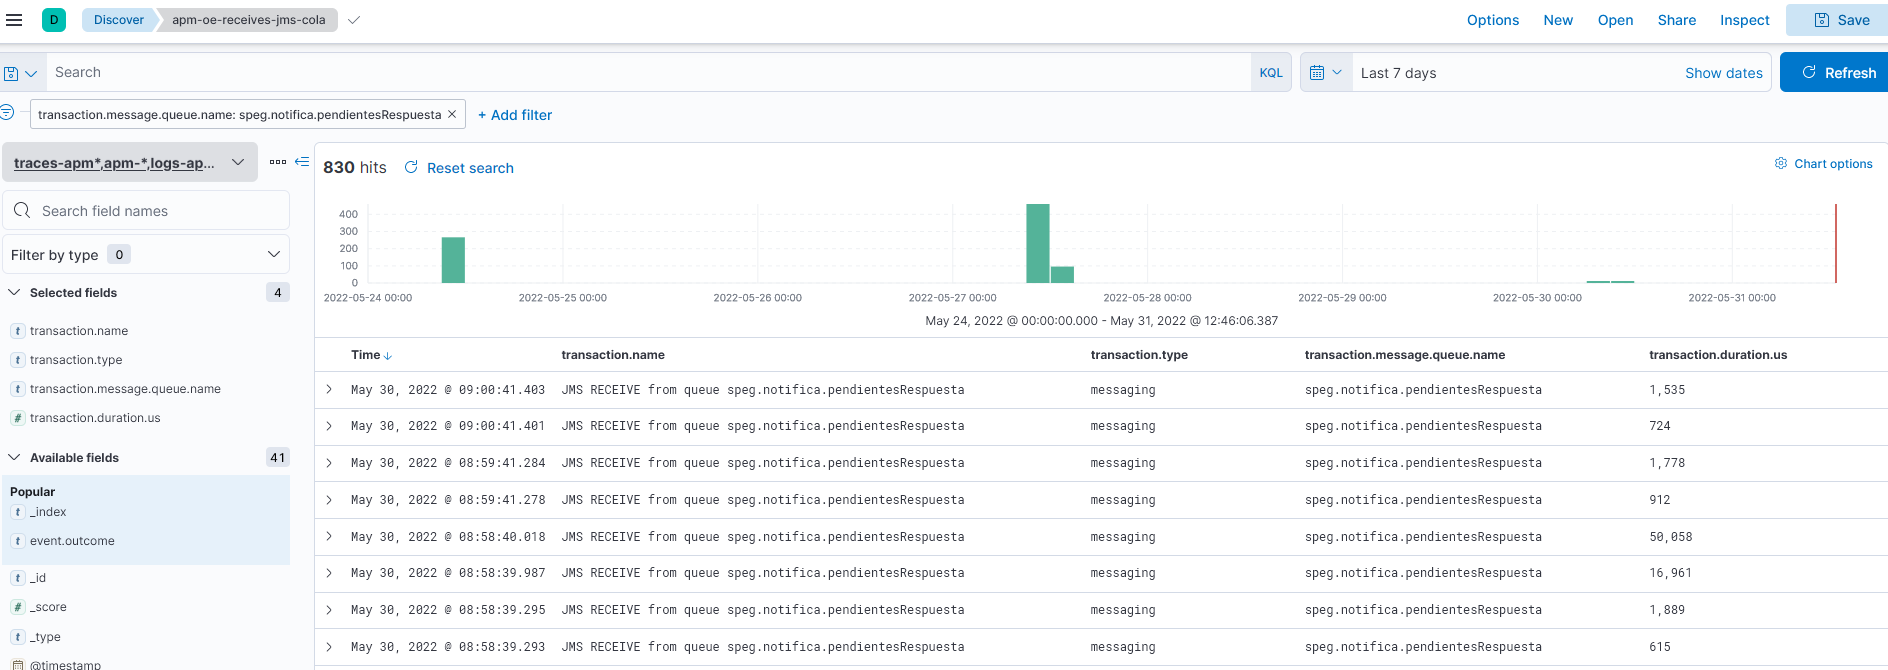
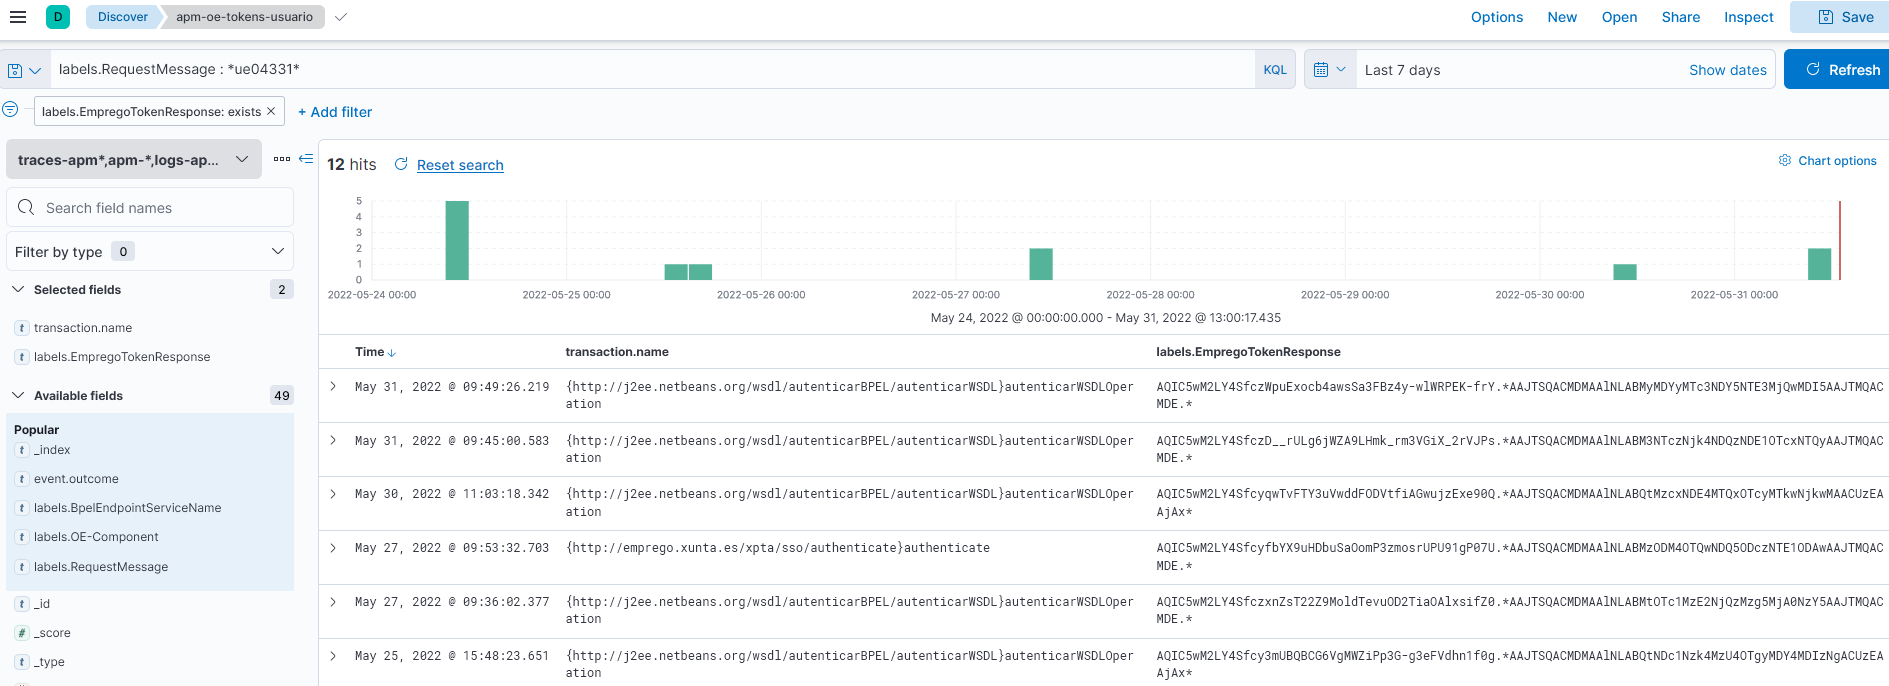
- apm-oe-tokens-usuario
Shows the tokens obtained by a user based on their identifier.
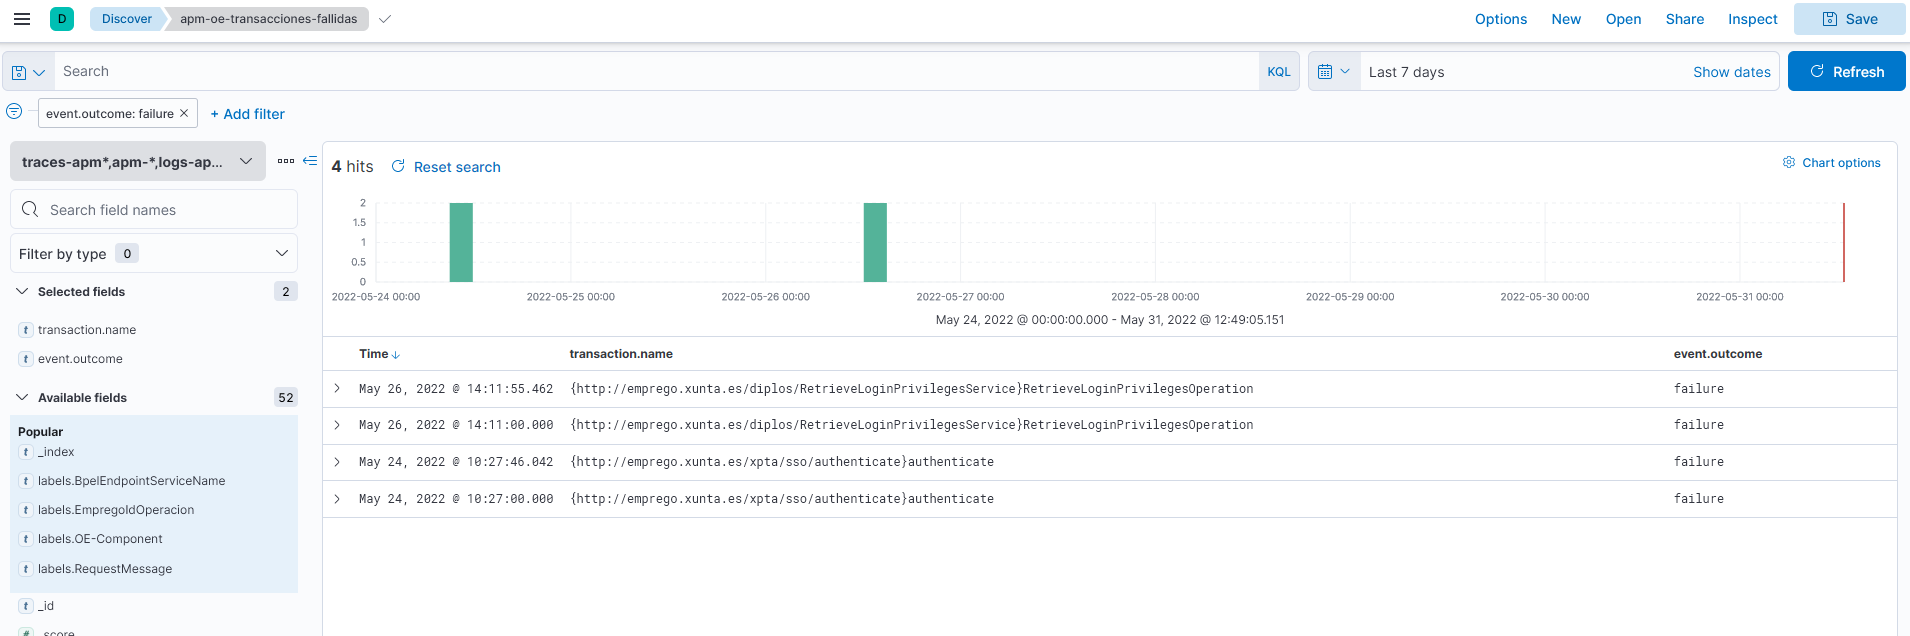
- apm-oe-transacciones-fallidas
Shows transactions with unhandled errors.
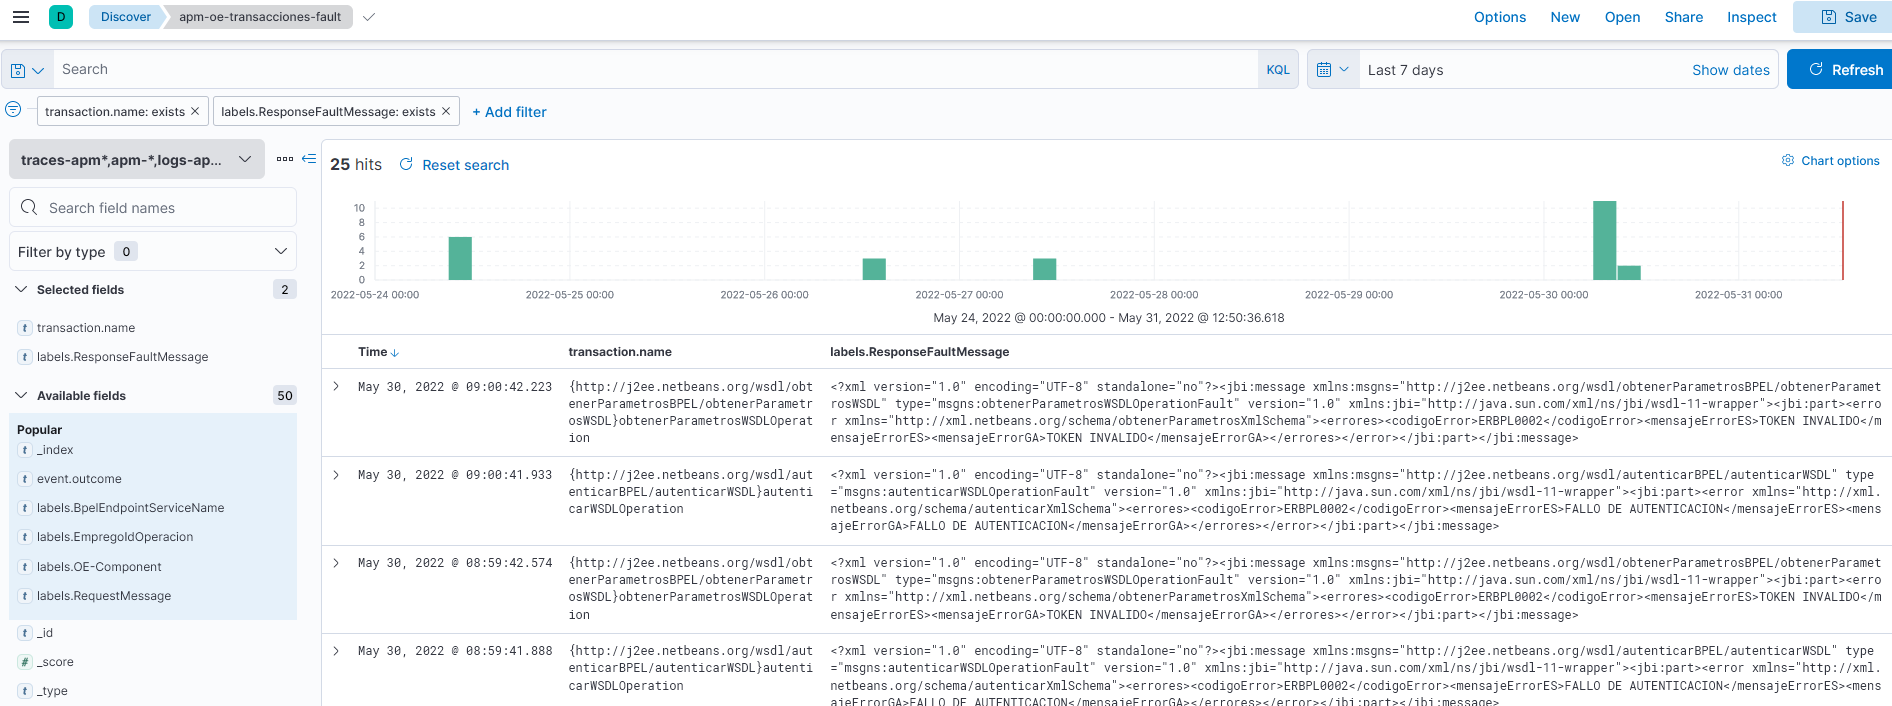
- apm-oe-transacciones-fault
Shows transactions that ended with a handled error.
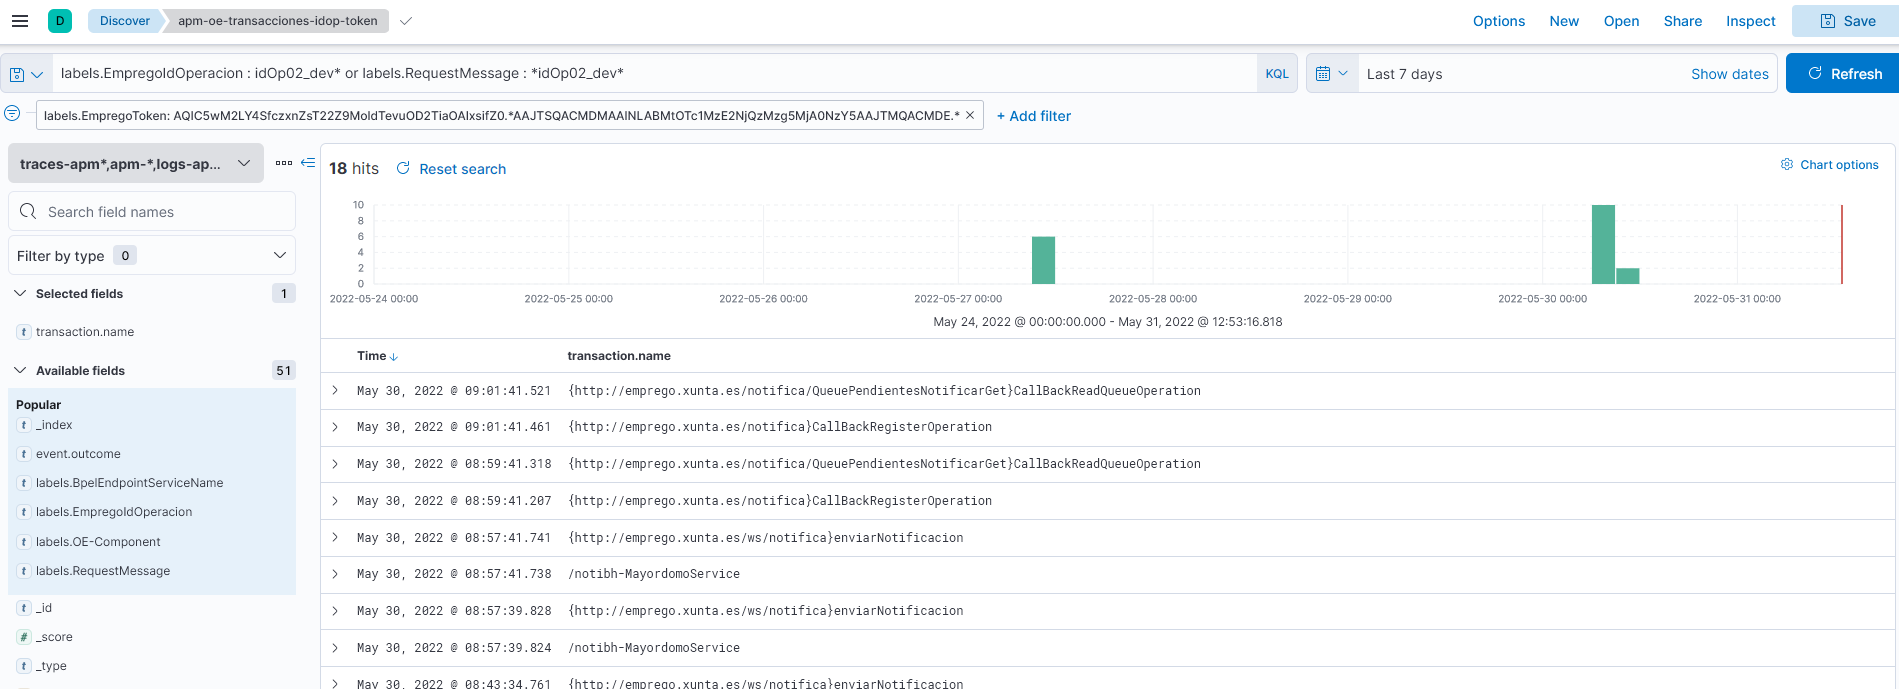
- apm-oe-transacciones-idop-token
Shows transactions for an operation ID and token.
-
apm-oe-transacciones-idop-namespace
Shows transactions for an operation ID and namespace.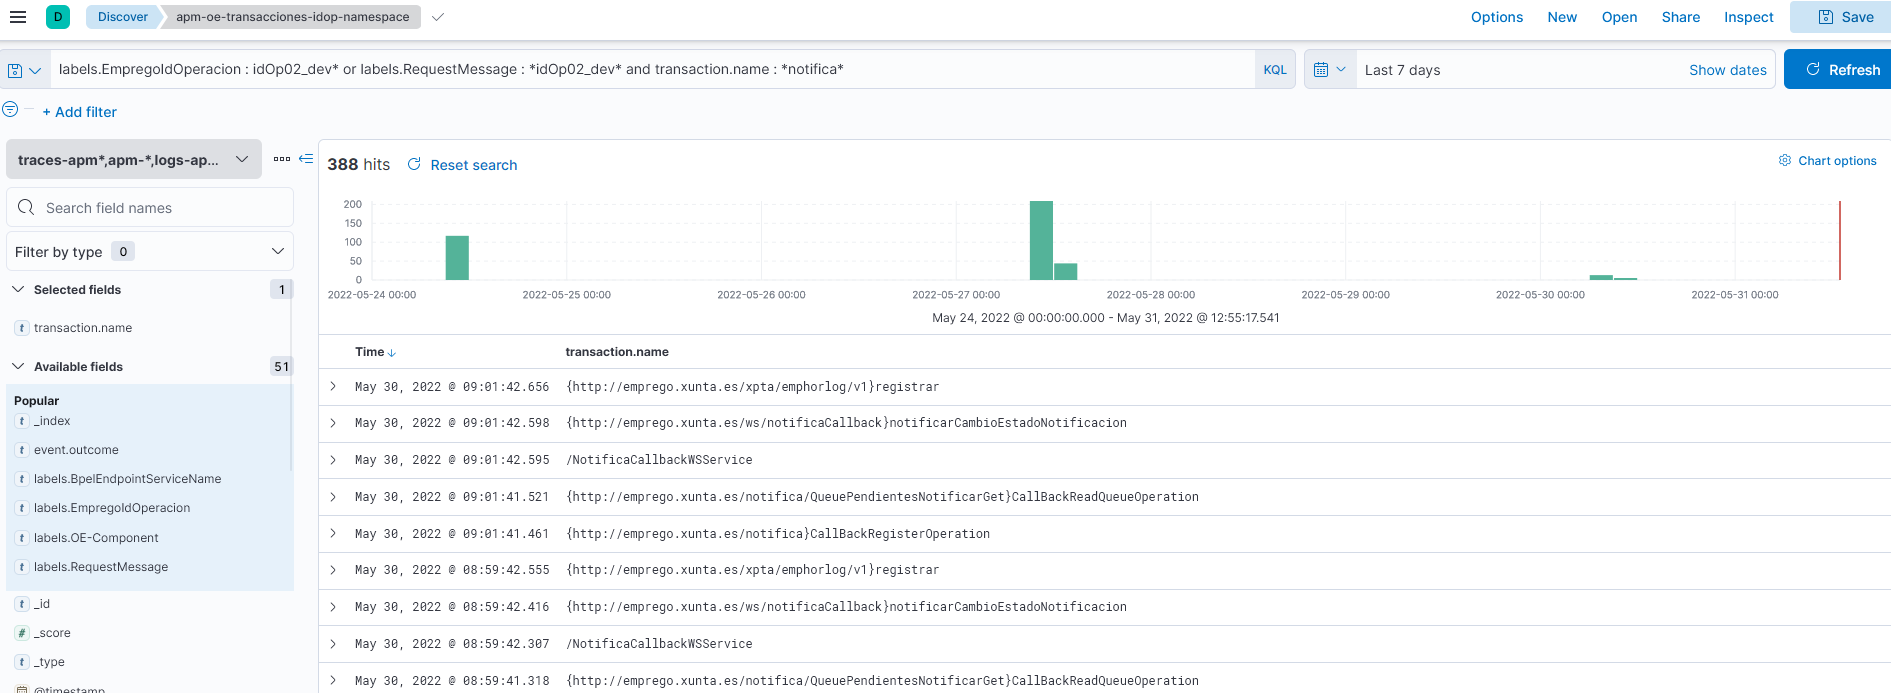
-
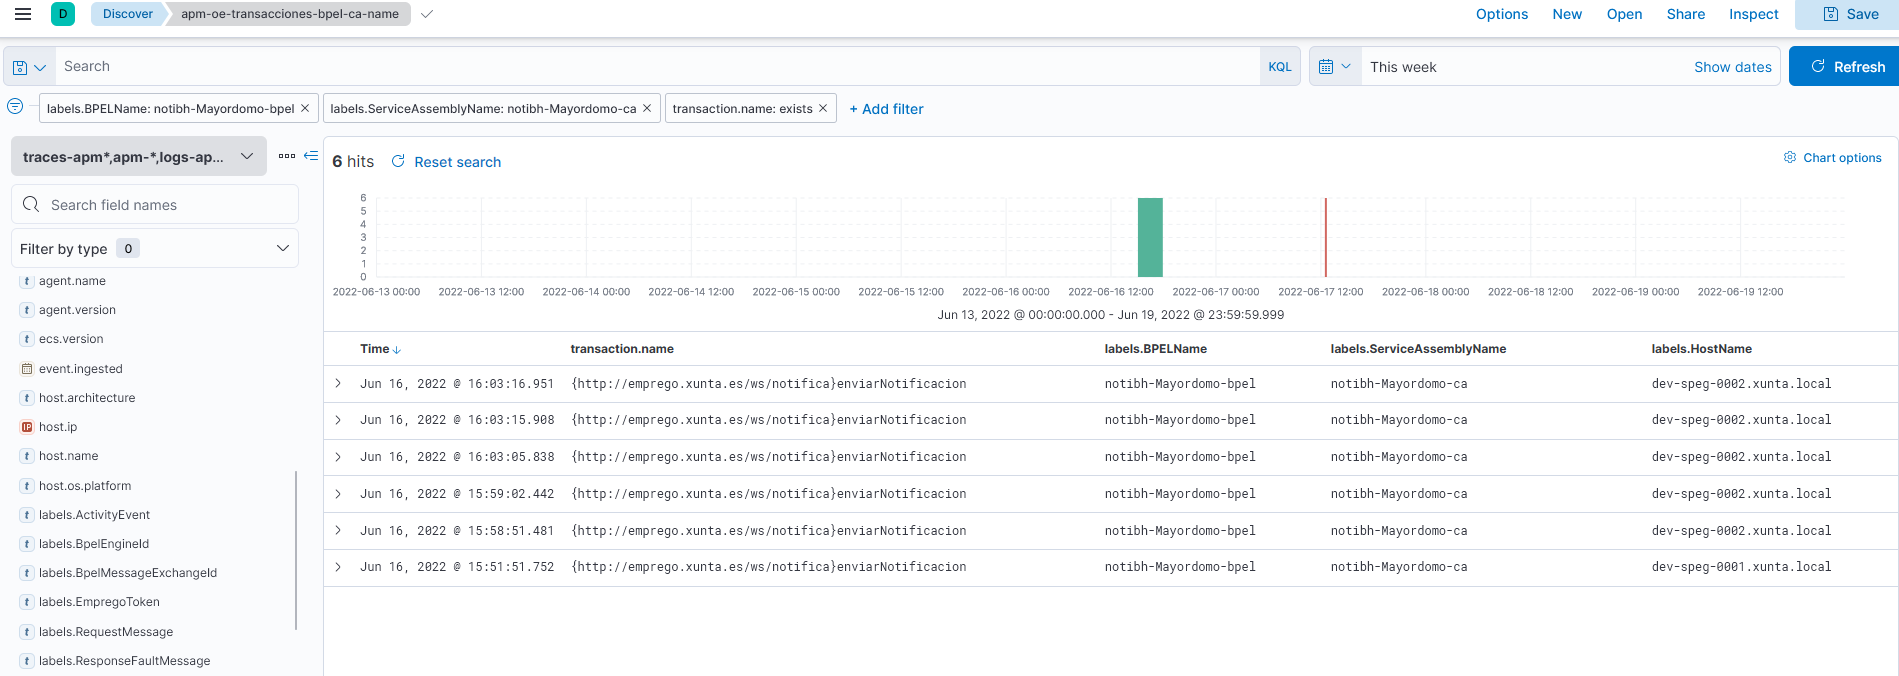
apm-oe-transacciones-bpel-ca-name
Shows transactions by searching for the BPEL name or CA name. It also allows searching the spans of those transactions by temporarily disabling the corresponding filter.
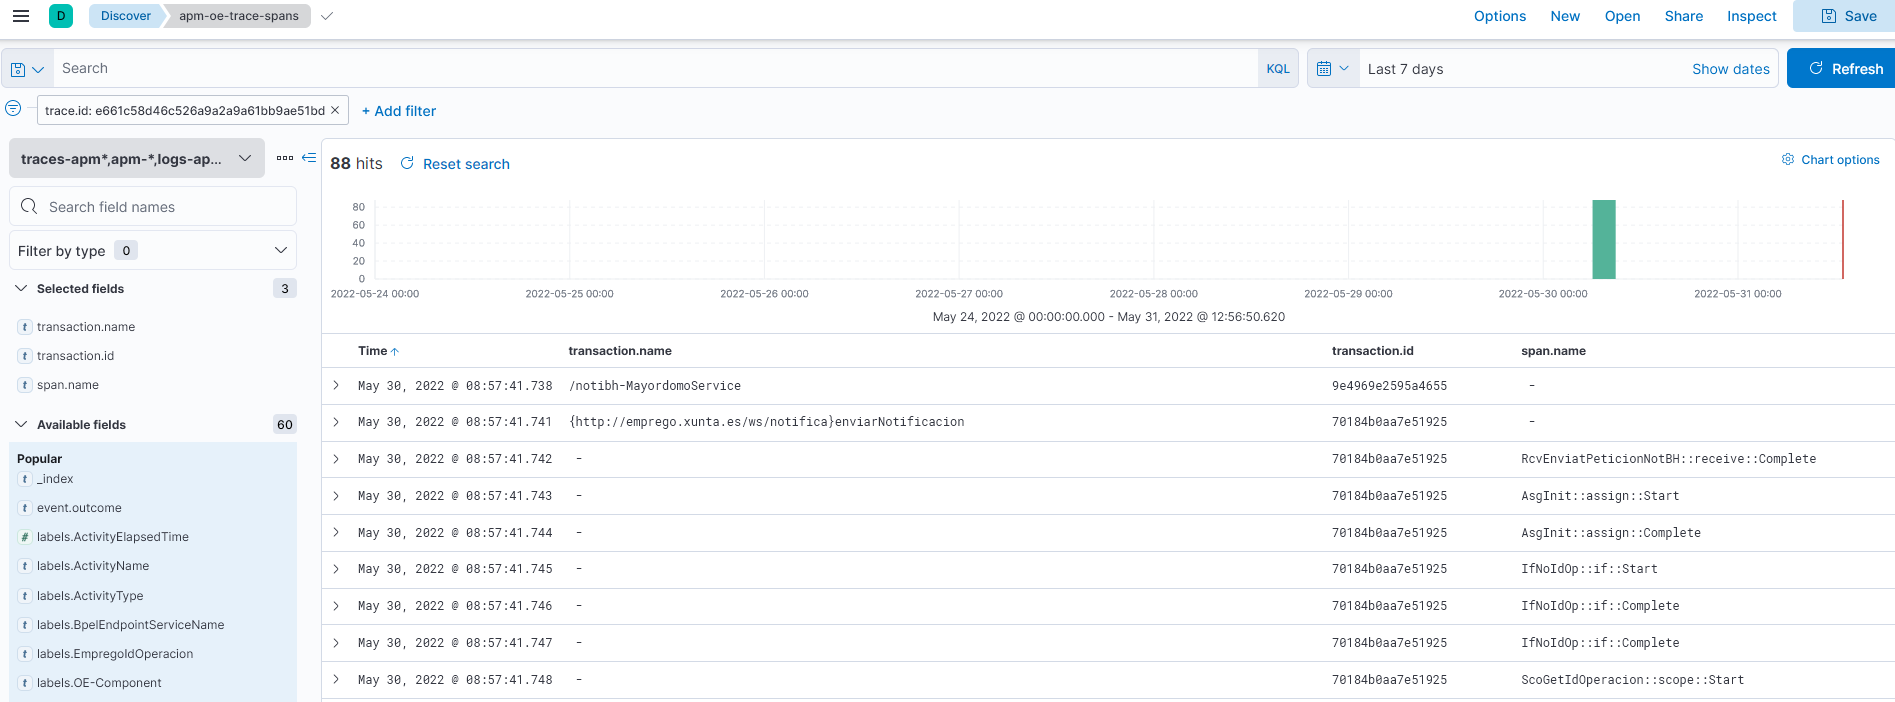
- apm-oe-trace-spans
Shows the spans for a trace ID, making it possible to see all activities executed for a specific invocation, including all BPEL processes started by the same transaction.