Performance Monitoring with Elastic
The Vico Open Modeling OpenESB distribution integrates with Elastic APM in order to provide a centralized OpenESB monitoring console.
Objectives
The goal of this content is to describe how to use the ELK APM platform to monitor the Vico Open Modeling OpenESB distribution.
To achieve this, the content is organized into three main chapters: APM, Logs, and Metrics. Each chapter includes a brief introduction to these concepts and then details what information from a Vico OpenESB instance is published to the Elastic server.
The target audience for this content is system administrators responsible for monitoring the behavior of an OpenESB instance.
The content is grouped into the following chapters:
-
#Application-Performance-Monitoring: Introduction to Elastic APM: what it is, its main components, and the data model. It also describes how the Vico OpenESB distribution integrates OpenESB runtime data (bindings, BPEL processes, activities, etc.) into the APM data model and extends it with custom labels.
-
#OpenESB-Log-Integration-with-Filebeat
-
#OpenESB-Metrics
OpenESB Performance Monitoring with Elastic
This content describes how to monitor the performance of an OpenESB instance using Elastic Application Performance Monitoring (APM). To do so, it is necessary to use the Open Source OpenESB distribution provided by the company Vico Open Modeling, which includes, among other improvements, connectivity with the Elastic monitoring platform.
Introduction
When we talk about Application Performance Monitoring (APM), it is useful to mention it together with the other aspects of "observability": logs and infrastructure metrics. Logs, APM, and infrastructure metrics form what the company Elastic defines as the observability trifecta.
There is some overlap between these areas, enough to help correlate them. Logs may indicate that an error occurred, but they may not explain how it happened. Metrics may show that CPU usage spiked on a server, but they may not indicate what caused it. When used together, they make it possible to solve a much wider range of issues.
(Source: Elastic blog: "Monitoring applications with Elasticsearch and Elastic APM")
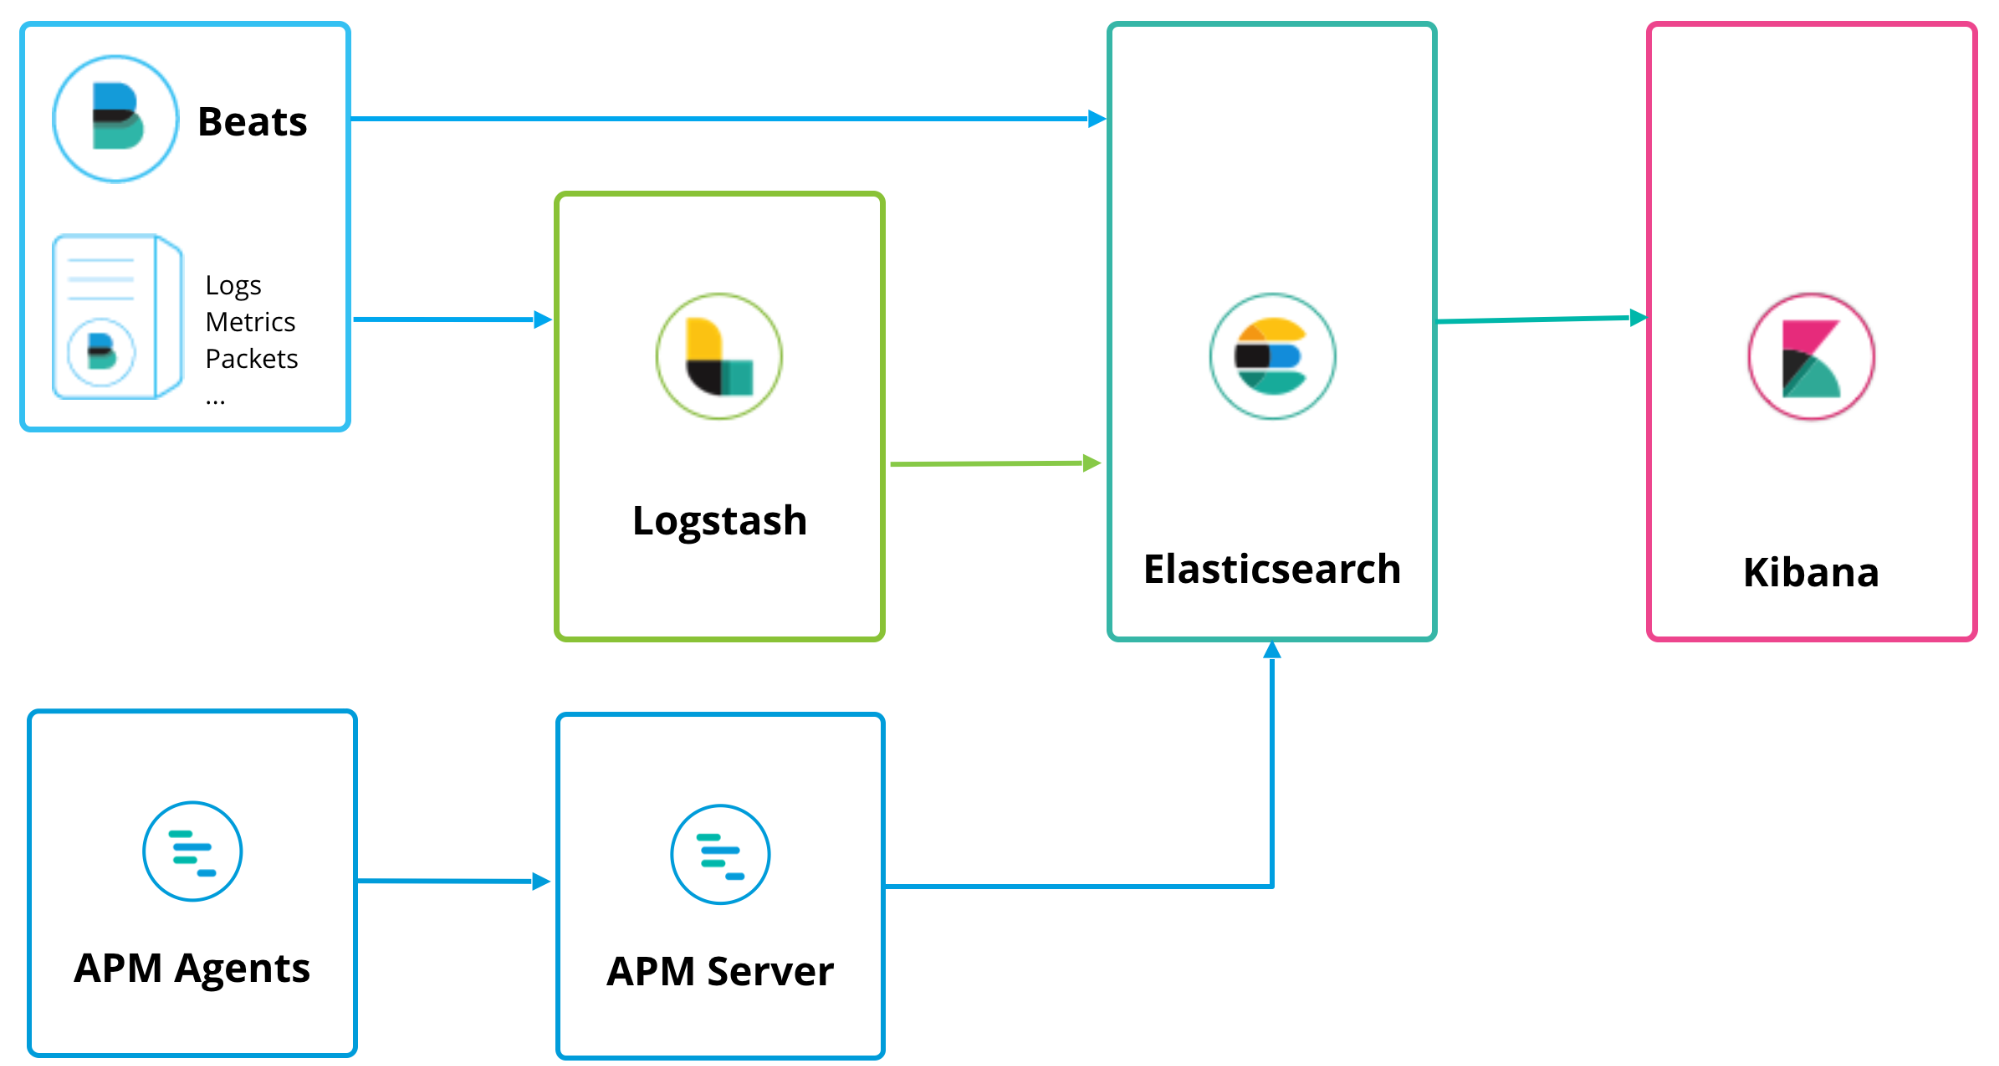
With the goal of providing a unified tool capable of showing what is happening in one of the infrastructure components (such as the Service Bus), Elastic provides the following components:
-
Beats / Logstash: Collectors for log files and runtime metrics.
-
APM Agents: Agents that monitor application execution and provide execution traces.
-
APM Server: Collector of logs and performance metrics.
-
Elasticsearch: Storage engine for unstructured information (JSON documents).
-
Kibana: Web console used to create dashboards and analyze the information stored in Elasticsearch.
The following image shows these components and their relationships.
The Vico Open Modeling OpenESB distribution integrates with Elastic APM in order to provide a centralized OpenESB monitoring console.
Objectives
The goal of this content is to describe how to use the ELK APM platform to monitor the Vico Open Modeling OpenESB distribution.
To achieve this, the content is organized into three main chapters: APM, Logs, and Metrics. Each chapter includes a brief introduction to these concepts and then details what information from a Vico OpenESB instance is published to the Elastic server.
The target audience for this content is system administrators responsible for monitoring the behavior of an OpenESB instance.
The content is grouped into the following chapters:
-
#Application-Performance-Monitoring: Introduction to Elastic APM: what it is, its main components, and the data model. It also describes how the Vico OpenESB distribution integrates OpenESB runtime data (bindings, BPEL processes, activities, etc.) into the APM data model and extends it with custom labels.
-
#OpenESB-Log-Integration-with-Filebeat
-
#OpenESB-Metrics